

node 24.19 out of memory - Fix the Upgrade Crash
Skilldham
Engineering deep-dives for developers who want real understanding.
Last updated: October 2026
TL;DR
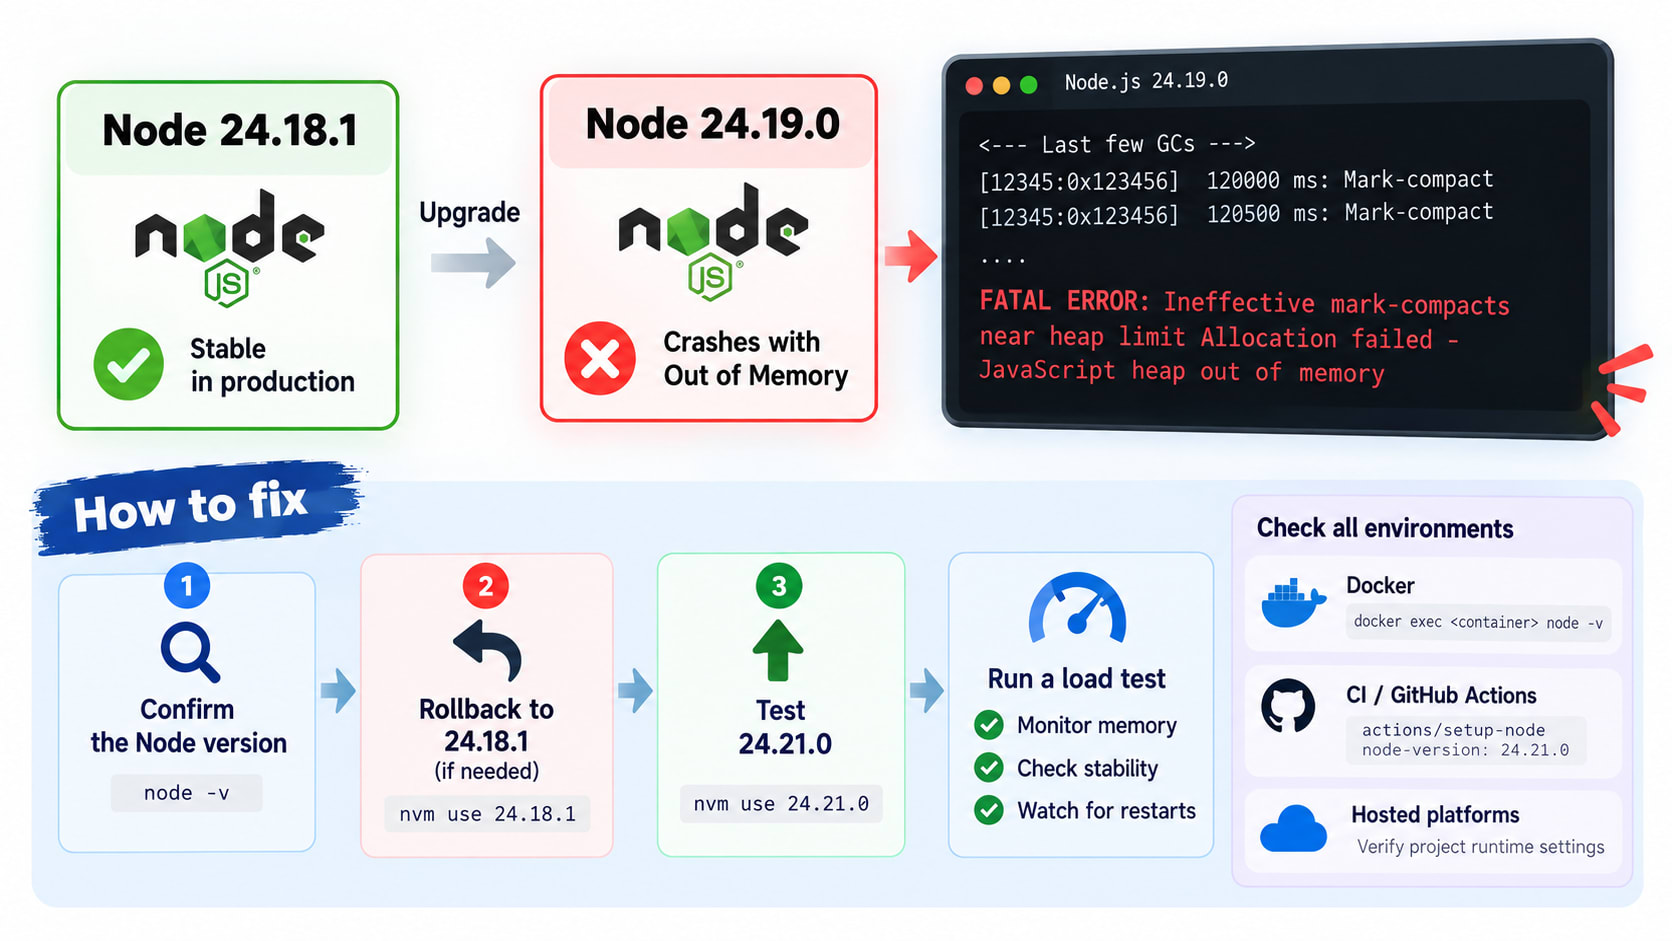
If Node.js 24.19.0 started crashing with JavaScript heap out of memory after 24.18.1 was stable, treat the runtime upgrade as the first suspect. Node.js has an open issue tracking multiple independent reports. Rolling back to 24.18.1 stopped the crashes in those reports. Node.js 24.21.0 is now available, so test it before keeping the old runtime.
The node 24.19 out of memory problem
You upgrade Node.js from 24.18.1 to 24.19.0.
Your application code stays the same.
Then production starts dying with a heap error.
The failure may appear after minutes or hours. That makes the incident look like a normal memory leak.
It is not safe to assume that yet.
The Node.js issue tracker records three independent reports. They covered Docker, Heroku, and production workloads.
All three reports linked the crash to the 24.19.0 upgrade. Rolling back to 24.18.1 stopped the problem.
The exact failure
The reported crash includes this message:
// Error: Node.js 24.19.0 reaches the JavaScript heap limit
FATAL ERROR: Ineffective mark-compacts near heap limit Allocation failed - JavaScript heap out of memory
The same report shows repeated garbage collection near a 2 GB heap.
The process then fails after it cannot free enough memory.
This is a useful clue.
The application did not suddenly change. The Node runtime did.
Why the timing matters
A normal memory leak can happen on any supported Node version.
A regression tied to one runtime version has a different first check.
Compare the deploy that worked with the deploy that failed.
Keep the application code, lockfile, traffic, and container settings the same. Change only the Node version.
That gives you a clean A/B test.
Why 24.19.0 can look like a memory leak
The hardest part of this bug is the delay.
A process can run for a long time before it crashes.
That pattern can fool your first diagnosis.
Load exposes the problem
The Node.js help report describes the crash under load.
One test ran for hours before failing. Another failed after about two minutes.
That means local testing can miss the problem.
Your laptop may run the same application without enough sustained work to trigger it.
Production has more requests, timers, buffers, async work, and long-lived objects.
The heap error is real
Do not ignore the OOM message.
Node is reporting a real heap limit failure.
But the message alone does not prove that your application has a leak.
The Node.js issue report says metrics did not show evidence of an actual memory leak.
The same report says rollback to 24.18.1 resolved the crash.
That version comparison is the key diagnostic signal.
The wrong first fix: raise the heap
A common response is to add --max-old-space-size.
That can help when your workload genuinely needs more JavaScript heap.
It is not the first fix for a runtime regression.
Why more heap can hide the problem
Suppose your process reaches the heap limit at 2 GB.
You raise the limit to 4 GB.
The process may now run longer. That does not prove the underlying issue is fixed.
You have only moved the limit.
For normal memory pressure, a larger heap can be valid.
For a version regression, changing the limit can make the failure harder to reproduce.
If your application really is hitting a container memory limit, the diagnosis is different. See the Node.js OOMKilled Kubernetes guide for the relationship between Node heap settings and container memory.
When the heap flag is valid
Use the flag when profiling shows that your application needs more heap.
For example, a build or worker may process a large data set.
// Correct: Raise the heap only after confirming real memory pressure
node --max-old-space-size=4096 server.js
For Kubernetes, also account for the container memory limit.
Your Node heap is only one part of the process memory budget.
The safest Node version fix
If 24.19.0 caused the crash, stop treating 24.19.0 as your only choice.
Node.js 24.20.0 was released before the current 24.21.0 release.
Node.js 24.21.0 is now available as a later 24.x LTS release.
The practical fix is to test a later 24.x release.
If your application is failing on 24.19.0, test 24.21.0 first.
Upgrade to 24.21.0
For local development with nvm:
// Correct: Pin a later Node 24 LTS release
nvm install 24.21.0
nvm use 24.21.0
node -v
Then reinstall dependencies with the same lockfile:
// Correct: Keep dependency versions fixed during the runtime test
rm -rf node_modules
npm ci
node -v
npm run start
Do not change application code and Node at the same time.
You want the runtime change to be the main variable.
Docker deployment
If production uses Docker, pin the image tag.
// Correct: Pin the Node runtime used by production
FROM node:24.21.0-bookworm-slim

WORKDIR /app
COPY package*.json ./
RUN npm ci

COPY . .
CMD ["node", "server.js"]
Avoid a floating tag while debugging this incident.
You need to know exactly which runtime your container uses.
The Node.js issue included reports from Node 24 Docker images.
That makes the runtime version worth checking before changing application memory settings.
SkillDham also covers another Node 24 deployment problem in the Node 24 native module Docker build guide.
Verify the Node version in production
This step sounds simple.
It gets missed during real incidents.
Your local shell can show Node 24.21.0.
Your CI can build with another version.
Your production container can run a third version.
That is why the deployed process should report its own runtime.
Check Docker and CI
Add a version check to your build or deployment logs.
// Correct: Print the runtime used by the build
node --version
npm --version
For Docker, check the running container:
// Correct: Inspect the runtime inside the running container
docker exec  node --version
For CI, pin the same version used in production.
// Correct: Keep CI on the same Node 24 release
- uses: actions/setup-node@v5
  with:
    node-version: 24.21.0
    cache: npm
Replace the action version with the version supported by your CI setup.
The important part is the Node version.
Check hosted platforms
Hosted platforms can apply their own Node settings.
Check the project runtime setting and the deployment logs.
Do not trust only your local .nvmrc.
If your app works locally but fails after deployment, compare these values:
Node version
npm version
lockfile
environment variables
memory limit
CPU limit
startup command
This same "works locally, fails in deployment" pattern appears in many backend incidents.
A clean rollback and upgrade workflow
The goal is not to guess.
The goal is to isolate the runtime change.
Step 1: Confirm the regression
Record the failing runtime first.
// Correct: Capture the failing runtime before changing anything
node --version
npm --version
If production reports 24.19.0, keep that evidence with the incident.
Then check when the first OOM appeared.
Compare it with the 24.19.0 deployment.
Step 2: Test the known-good baseline
If your previous production runtime was 24.18.1, restore it temporarily.
// Correct: Roll back to the last known-good runtime
nvm install 24.18.1
nvm use 24.18.1
node --version
For Docker, use your previous image tag.
The Node.js issue reports that this rollback stopped the OOM in the affected cases.
That makes it a useful diagnostic test.
Step 3: Test 24.21.0
Once the baseline is stable, move to 24.21.0.
Run the same load test.
Keep the dependency lockfile unchanged.
Watch heap usage, restart count, response latency, and container memory.
// Correct: Compare the later Node 24 release under the same workload
nvm use 24.21.0
node --version
npm ci
npm run start
If 24.21.0 stays stable, you have stronger evidence that 24.19.0 was the trigger.
If it still crashes, stop calling it only a 24.19.0 regression.
Profile the application and check current Node 24 issues.
How to debug if the OOM continues
Not every Node OOM is caused by Node 24.19.0.
Your application can still leak memory.
Native modules can also consume memory outside the JavaScript heap.
Check heap growth
Start with process memory metrics.
// Correct: Log the main Node memory counters
setInterval(() => {
  const memory = process.memoryUsage();

  console.log({
    rss: memory.rss,
    heapTotal: memory.heapTotal,
    heapUsed: memory.heapUsed,
    external: memory.external,
    arrayBuffers: memory.arrayBuffers
  });
}, 30000);
Look for a steady rise in heapUsed.
Also watch rss and external.
A rising rss with stable heapUsed can point outside the normal JavaScript heap.
Use GC traces for deeper evidence
Node provides GC tracing for memory debugging.
// Correct: Collect garbage collection traces during a controlled test
node --trace-gc server.js
Do this in a test environment first.
GC tracing can create a lot of output.
If you find a real application leak, fix that leak.
Do not keep changing Node versions forever.
For another related build-memory problem, the Next.js 16 cacheComponents build OOM guide shows why build-time OOM and runtime OOM need separate diagnoses.
Key Takeaways
node 24.19 out of memory is a real upgrade regression signal, not proof of an application leak.
Compare Node 24.18.1 and 24.19.0 before changing application code.
Roll back to 24.18.1 when you need a fast production recovery.
Test Node 24.21.0 instead of staying on 24.18.1 forever.
Do not raise --max-old-space-size as your first response to this version-specific failure.
Verify the Node version inside Docker, CI, and production.
If OOM continues on a later Node 24 release, profile heap and process memory.
FAQ
Does Node 24.19.0 have an OOM regression?
There are multiple independent reports of OOM after upgrading from 24.18.1 to 24.19.0. The main Node.js issue records three reports and says rollback to 24.18.1 resolved the problem in those cases.
Should I downgrade from Node 24.19.0?
A rollback to 24.18.1 is a reasonable emergency recovery step. But Node.js 24.21.0 is now available, so test the newer 24.x LTS release before locking yourself to the older runtime.
Should I use max-old-space-size to fix this?
Not as your first move. A larger heap can delay an OOM, but it does not prove that the runtime regression is fixed.
Why does Node 24.19.0 work locally?
The reported failures appeared under sustained load. Local traffic may not create the same memory pattern.
Does Docker cause the Node 24.19.0 OOM?
The reports include Docker and Heroku environments. That does not prove Docker caused the bug. Docker is useful for reproducing the runtime difference because you can pin exact Node image tags.
Is Node 24.21.0 safe from this issue?
Node 24.21.0 is a later Node 24 LTS release. It is the version to test instead of assuming 24.18.1 must remain your permanent workaround. Still run your own production-like load test before a full rollout.
How do I check the Node version in Docker?
Run docker exec <container-name> node --version. Also print the version during CI and application startup.
What if my app still runs out of memory?
Treat that as a separate memory investigation. Check heapUsed, rss, external, GC behavior, container limits, and recent dependency changes.
Conclusion
The key lesson is simple: a Node.js upgrade can change production memory behavior without changing your application code.
If Node 24.19.0 is the first version that crashes, compare it with 24.18.1 first.
Use rollback for recovery, then test Node 24.21.0 as the newer 24.x path.
Do not hide a runtime regression behind a larger heap limit.
Verify the deployed runtime, reproduce under the same load, and measure memory before changing more variables.
For more practical version-specific debugging guides, explore the SkillDham developer blog.